“When there is an income tax, the just man will pay more and the unjust less on the same amount of income.” A quote by Plato, (428BC-348BC) the famous ancient Greek philosopher. This is an early recording of behavioural psychologies towards taxation which is something I will discuss in this essay. Throughout this paper I aim firstly to see whether raising tax rates necessarily raise revenue. To do this I will look in depth at the Laffer curve and use it for my evaluation. I will also look at what factors affect how tax revenue changes when tax rates change.
To see how raising tax rates may or may not increase tax revenue, we can look at the theory of the laffer-curve.

Figure 1: laffer curve, wikipedia
The laffer curve shows the relationship between tax rates and tax revenue. The optimizing revenue collection tax rate (not to be confused with the optimal tax rate) is at t*, where the maximum tax revenue would be generated. The diagram theorizes that if you raise taxes above t*, then tax revenue may actually fall. This could be for a number of reasons, such as the people leaving the country or investing in tax avoidance, which I will go into greater detail on later in this essay.
Evidence of the laffer curve in practise exists from past data. Perloff gives an example by drawing on work from Fullerton (1982) and Stuart (1984). Fullerton concluded that the t* rate in America was 79% and Stuart calculated this figure at 85%. Using these figures, Perloff (2001: p.140) noted that, “Given the American t* is between 79% and 85%, the Kennedy era tax cut (from 91% to 70%) raised tax revenue and increased the work effort of top-income-bracket workers, but a Reagan era tax cut (in which the actual rate was about half as a big as t*) had the opposite effects.” The former showing the right hand side of the Laffer curve whilst the latter showing the left.
Knowing where the t* rate resides is a matter of heated debate in many countries. For example, there was a lot of controversy over the 50p tax rate in Britain, enforced in April 2010. People were worried that if the tax was enforced, it would be destructive to the economy. It was argued by the Institute of directors, “that the new rate would damage business confidence, foreign investment and entrepreneurial aspiration.“ (BBC news, 6 April 2010) They felt that the tax would reduce long-term tax revenue and we’re not alone with this view. Looking at the diagram they were essentially saying the higher rate of tax in Britain was already at or above the t* tax rate. Figures of the revenue raised by the tax will not be published until after January 2012, however there have been recent calls by leading economists, urging the government to drop the tax at the “earliest opportunity”, claiming it is doing “lasting damage” to the economy. (BBC news, 7 September 2011)
The laffer curve theorizes that raising taxes may in fact reduce tax revenue. Capital gains tax in America, 1985 and 1994 (inflation adjusted) gives us another example of this. In 1985 the tax revenue was $36.4 billion and then in 1987 there was increase on capital gains tax. Revenue from this tax declined after this and in 1994 the revenue fell by .2 billion to $36.2 billion, “even though the economy was larger, the tax rate was higher, and the stock market was stronger in 1994.” (Jim Saxton, 1997)
A well known advocate of the laffer-curve, a man called William Kurt Hauser, created a theory that is known as ‘Hauser’s Law’. This states that “federal tax revenues since World War II have always been approximately equal to 19.5% of GDP, regardless of wide fluctuations in the marginal tax rate.”(Wikipedia, 2011) Hauser’s law is important, as it gives us some empirical evidence of the principle behind the laffer-curve.

Figure 2: Hauser’s law (from J.D. Tuccille, tuccille.com)
Looking at the graph above we can see the top individual tax bracket in comparison to the revenue as a percentage of GDP. We can clearly see that no matter what the marginal tax rate of the top income earners has been, revenue as a percentage of GDP has be steadily fluctuating around 18-20%. This shows that raising tax rates does not always raise tax revenue.
There are some criticisms of Hauser’s law as well as the laffer curve. Daniel J. Mitchell, a columnist for Forbes.com, argues that Hauser’s law is in existence in America because they have a federalist tax system unlike lots of countries in Europe who have a national sales tax (V.A.T), and also because they have a more progressive tax system. He believes the tax system in America represents a political trend and so Hauser’s law essentially does not represent true economic law. (Daniel J. Mitchell, 2010) The main criticism of the Laffer curve is to do with its shape as no-one truly knows how It looks. It is also argued that at 100% taxation, revenue will not necessarily be 0, as some people work for charities and other enjoy their jobs etc.
We can construe from these criticisms that if Hauser’s law only exists in the USA, then perhaps that is because of their tax composition and therefore, the types of taxes that a government pursues effects how much revenue is raised with a tax increase/decrease. I will discuss the shape of the laffer curve further on in the essay and will now go on to explain the factors which affect how tax revenue changes with tax rate changes.
In 2006, a report by Louis Levy-Garboua, David Masclet and Claude Montmarquette for Quebec’s Centre Interuniversitaire de Recherche en Analyse des Organisations (CIRANO) looked at behavioural factors affecting tax revenue. They came to the overall conclusion that “The Laffer curve arises both from asymmetry of equitable rewards and punishments and from the presence of a substantial share of emotional rejections of unfair taxation.” (Louis Levy-Garboua, David Masclet, Claude Montmarquette, 2006)
They say that the Laffer curve is caused by unfair rises in taxation which are considered personal and make people more likely to try to find ways to avoid paying their taxes. When taxes are perceived as exogenous and impersonal, they feel that the Laffer curve does not kick in. This suggests again that different types of taxes are more or less likely to raise revenue than others. Perhaps, for example, a ‘stealth tax’ which is used by governments to increase their revenues without raising the ire of taxpayers is a better method to raising revenue than by increasing a more direct and personal tax, such as income tax.
Kurt Brouwer also talks about how behaviour affects how tax revenue changes when tax rates change. He gives an example using capital gains tax. Capital gains tax is a “tax on the profit or gain you make when you sell or ‘dispose of’ an asset.” For example, if you bought credit default swaps for £5000 and then sold them next year for £12000, you’ve made a gain of £7000 and this is the figure that will be taxed. (HM revenue and customs) Brouwer argues that there is a clear correlation between capital gains tax and the realization of gains. He says, “when capital gains tax rates go up, investors slow down realization of gains. So, despite a higher capital gains tax rate, the actual revenue received from capital gains taxes may not go up much.” And vice versa. He argues that overall, an increase in tax rates may not actually increase tax revenue. (Kurt Brouwer, 2010)
David Ranson, the head of research at H.C. Wainwright & Co. Economics Inc, again, talks about behaviour towards taxation saying, “Raising taxes encourages taxpayers to shift, hide, and underreport income. . . . Higher taxes reduce the incentives to work, produce, invest and save, thereby dampening overall economic activity and job creation.” He suggests that rather than looking at taxation to increase revenue, we should look at increasing GDP. (David Ranson, 2008)
Ranson, Brouwer and the report from CIRANO all speak about behavioural psychologies towards taxation. When taxes are raised above a certain level people may be more likely to change their behaviour. If the taxes are seen as high and unjustly so, then perhaps for example, people will invest more into tax avoidance, convert more income into capital gains, have reduced incentives to work, or even leave the country. We can deduce that the populace behaviour has an impact on how tax revenue changes with a rise in taxation.
Another issue discussed briefly before in this essay which affects how tax revenue changes with tax rate changes is the composition of the Laffer curve. Although it is widely accepted that there will be no tax revenue at 0% taxation and (although disputed in some cases) at 100% taxation, it is unclear as to what the Laffer curve actually looks like, and it is more than likely that it differs from country to country because of different views and behaviours towards taxation.
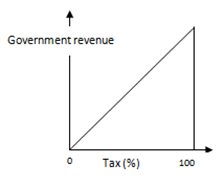
Figure 3
For an example, If we had a Laffer curve which looked like the one I have drawn above (Figure 3), it would be beneficial for a government to tax up to 99%, as tax revenue would keep rising up until this point. However, If we had a Laffer curve which looked more like Figure 1, then taxing above 50% would cause revenue to fall. Therefore the composition of the Laffer curve is a huge factor in how raising taxes would affect tax revenue. As I have previously stated; exactly where the t* rate lies and what the Laffer curve looks like is heavily debated. Looking at figure 2 again we can say that the t* rate in America should be the smallest value at which the revenue raised is around 18-20% of GDP. Going above this figure will not raise anymore taxes and it is possible that it will needlessly cause GDP to fall.
For another example to see what factors affect whether raising taxes increase tax revenue, we can look at the backwards bending supply of labour curve.

Figure 4: W.Morgan, M.Katz and H.Rosen, (Microeconomics, 2009)
Looking at the diagram A (above), the budget lines shows us different wage rates. At the bottom wage rate (slope = -w3), according to the indifference curve, the amount of leisure and consumption that will be consumed is e3. As we move up the wage rates to we can see that the first shift causes the endowment point to change to e2, where the consumer works more than before, however as we move up to the next wage rate we can see that at e3, the consumer starts to work less. We can explain this by talking about income and substitution effects. (W.Morgan, M.Katz and H.Rosen, 2009)
The income effect shows us the change in consumption due to a change in the consumers income and the substitution effect shows us how a change in income changes the supply of labour. Looking at figure 1, diagram A we can see that these two effects are opposite. From e1 to e2 the income effect is dominating the substitution effect. At this point people would rather increase their consumption than leisure, as consumption rises more than hours of leisure. However, from endowment e2 to e3, people would rather have more hours of leisure than consumption. The substitution effect dominates the income effect. (W.Morgan, M.Katz and H.Rosen, 2009)
From this evaluation you can see how figure 1, diagram B is formed. As first as wages rise, people work more until the wage rate rises above a certain point and people decide to reduce hours. Thinking about taxation, people will work more if the tax rate rises when they are in the backwards bending section of their labour supply curves as real wages fall. However, as the tax rises further, workers will be in the upward sloping section, and therefore an increase in the tax will reduce the number of hours worked. The optimizing revenue tax rate will be where the most hours are worked as this will produce the most amount of tax revenue. We can say that the size of the income and substitution affect has a impact on how much revenue will be raised with a rise in taxation.
I do not however feel that the backwards bending supply of labour curve shown necessarily shows the whole picture. For example, if you raise income tax it’s essentially a cut in real wages so (according to the diagram) you should work less if you are in the upwards-sloping section. However in reality most people have a contracted amount of hours and so whilst it may be easier to get over-time, to work less may not be an option for many people. Therefore I believe the curve should more inelastic and though the substitution and income effects will have some effect, I feel the that the effects are limited.
To conclude, raising taxes does not necessarily raise tax revenue. I have shown using theoretical analysis of the Laffer curve that if a tax is above the optimizing revenue rate, then an increase in taxation can actually cause a reduction in tax revenue. I have also backed up this theory with empirical evidence.
The first factor I have talked about which affects how tax revenues change with tax rates is behaviour. People respond in different ways to taxation and depending on how they respond, more or less tax revenue will be seen as a result of increase or decrease in tax rates. I also believe that the type of tax can cause different reactions as the 2006 report from CIRANO pointed out as well as conclusions surrounding Hauser’s Law. I have also talked about the income and substitution effects which link in with behaviour. Depending on how large each affect is and what the wage rate currently is at, people will respond accordingly. For example, if an increase in taxation caused people to give up hours of work for leisure then tax revenue may fall and vice versa, although as I have stated, I feel these effects are limited.
I also talked about the composition of the Laffer curve. Depending on what it looks like, and where the current taxation level resides, revenues could rise or fall with tax increases or decreases. Again, it can be said that the make-up of this curve can be related to the populace behaviour because exactly where the t* rate lies, depends on where people start reacting to tax rates. Finally, I stated the type of tax has an impact on revenue raised. However after researching I felt that there was a lack of data and that I could not confidently come to a conclusion about how revenue changes with specific taxes
Therefore, although I may have not covered all the factors affecting how tax revenues change with tax rates, I feel the main factor is populace behaviour. Populace behaviour entails how big the substitution and income effects are, the composition of the laffer and also how people react to certain types of taxation.
References
David Ranson, (2008) You Can’t Soak the Rich
BBC news. (06/04/2010) New 50% tax rate comes into force for top earners [Online] Available at: <http://news.bbc.co.uk/1/hi/uk/8604215.stm> [Accessed 22/12/2011]
BBC news. (07/09/2011) Top 50p tax rate damages UK, says economists [Online] Available at: <http://www.bbc.co.uk/news/business-14810323> [Accessed 22/12/2011]
Jim Saxton. (1997) The Economic Effects of a Capital Gains Taxation, [Online] Available at: <http://www.house.gov/jec/fiscal/tx-grwth/capgain/capgain.htm> [Accessed 22/12/2011]
Wikipedia. (last edited 2011) Hauser’s law, [Online] Available at: <http://en.wikipedia.org/wiki/Hauser’s_law> [Accessed 22/12/2011]
Daniel J. Mitchell. (2010) Will “Hauser’s Law” Protect Us from Revenue-Hungry Politicians? [Online]Available at: <http://www.forbes.com/sites/beltway/2010/05/21/will-hausers-law-protect-us-from-revenue-hungry-politicians/> [Accessed 22/12/2011]
Louis Levy-Garboua, David Masclet, Claude Montmarquette (2006) A Micro-foundation for the Laffer Curve In a Real Effort Experiment. [Online]Available at: <http://www.cirano.qc.ca/pdf/publication/2006s-03.pdf> [Accessed 22/12/2011]
HM revenue and customs, [Online] Available at: <http://www.hmrc.gov.uk/cgt/intro/basics.htm#1> [Accessed 22/12/2011]
Kurt Brouwer, (2010) Does hiking tax rates raise more revenue? [Online]Available at: <http://blogs.marketwatch.com/fundmastery/2010/07/02/does-hiking-tax-rates-raise-more-revenue/> [Accessed 22/12/2011]
Jeffery M. Perloff, 2001: Microeconomics. USA: Addison Wesley Longman, Inc. P.40.
Wyn Morgan, Michael Katz and Harvey Rosen, (2009) Microeconomics – 2nd European Edition. New York, McGraw-Hill Education (UK) limited.
Figure 1: http://en.wikipedia.org/wiki/File:Laffer-Curve.svg
Figure 2: J.D. Tuccille, Hauser’s Law, the Laffer curve and pissed-off taxpayers [Online] Available at: <http://www.tuccille.com/blog/2008/05/hausers-law-laffer-curve-and-pissed-off.html> [Accessed 22/12/2011]
Figure 4: Wyn Morgan, Michael Katz and Harvey Rosen, 2009: Microeconomics – 2nd European Edition. New York, McGraw-Hill Education (UK) limited. P. 146.


 the nominal deficit will increase by
  each year, as will the nominal debt, even if the budget is balanced, but the real level of debt is unchanged


